
|
|
|
|
#1
 04-13-2016, 11:01 PM
|
||||
|
||||
|
Hi 4 all.
I've got this homework and I don't know how to do it. In excel sheet, represent in a graphic the function 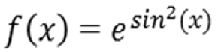 where x is -3.00 -2.90 -2.80 -2.70 -2.60 -2.50 -2.40 -2.30 -2.20 -2.10 -2.00 -1.90 -1.80 -1.70 -1.60 -1.50 -1.40 -1.30 -1.20 -1.10 -1.00 -0.90 -0.80 -0.70 -0.60 -0.50 -0.40 -0.30 -0.20 -0.10 0.00 0.10 0.20 0.30 0.40 0.50 0.60 0.70 0.80 0.90 1.00 1.10 1.20 1.30 1.40 1.50 1.60 1.70 1.80 1.90 2.00 2.10 2.20 2.30 2.40 2.50 2.60 2.70 2.80 2.90 3.00 where x is -3.00 -2.90 -2.80 -2.70 -2.60 -2.50 -2.40 -2.30 -2.20 -2.10 -2.00 -1.90 -1.80 -1.70 -1.60 -1.50 -1.40 -1.30 -1.20 -1.10 -1.00 -0.90 -0.80 -0.70 -0.60 -0.50 -0.40 -0.30 -0.20 -0.10 0.00 0.10 0.20 0.30 0.40 0.50 0.60 0.70 0.80 0.90 1.00 1.10 1.20 1.30 1.40 1.50 1.60 1.70 1.80 1.90 2.00 2.10 2.20 2.30 2.40 2.50 2.60 2.70 2.80 2.90 3.00 Maybe is a simple task, but I don't know if is correct this formula =EXP(SIN(A1)^2) or this one =2.71828*SIN(A1)^2, because I've got different results. Tks in advance for your answers! 
|
|
#2
04-13-2016, 11:25 PM
|
||||
|
||||
|
Hello
sadly, forums usually do not provide help for homework. The basic idea is that you do the research to find the answer. If you calculate manually the value of the function for some values of x you can then compare with the results your two formulas provide and decide which one is correct Good luck
__________________
Using O365 v2503 - Did you know you can thank someone who helped you? Click on the tiny scale in the right upper hand corner of your helper's post
|
|
#3
04-13-2016, 11:46 PM
|
||||
|
||||
|
Sorry, if I expressed myself wrong. I need to do this in excel, is not a homework for math class.
|

|
| Thread Tools | |
| Display Modes | |
|
|
 Similar Threads
|
||||
| Thread | Thread Starter | Forum | Replies | Last Post |
 Restrict Editing function disable insert textbox function Restrict Editing function disable insert textbox function
|
IanM_01 | Word | 5 | 11-21-2015 02:29 AM |
|
#REF! Error in calling VBA function disappears when function is copied
|
lcaretto | Excel Programming | 2 | 05-26-2014 07:19 PM |
|
how to change fraction representation to decimal representation as file attached
|
tomlam | Excel Programming | 10 | 02-02-2014 07:25 AM |
| Creating a graph for Future Value function (FV function) | bmoody | Excel | 2 | 11-06-2013 10:52 AM |
|
question in pictorial representation
|
gsrikanth | Excel | 1 | 03-02-2012 11:45 AM |


 Hybrid Mode