Hi 4 all.
I've got this homework and I don't know how to do it.
In excel sheet, represent in a graphic the function
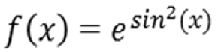
where x is
-3.00 -2.90 -2.80 -2.70 -2.60 -2.50 -2.40 -2.30 -2.20 -2.10 -2.00 -1.90 -1.80 -1.70 -1.60 -1.50 -1.40 -1.30 -1.20 -1.10 -1.00 -0.90 -0.80 -0.70 -0.60 -0.50 -0.40 -0.30 -0.20 -0.10 0.00 0.10 0.20 0.30 0.40 0.50 0.60 0.70 0.80 0.90 1.00 1.10 1.20 1.30 1.40 1.50 1.60 1.70 1.80 1.90 2.00 2.10 2.20 2.30 2.40 2.50 2.60 2.70 2.80 2.90 3.00
Maybe is a simple task, but I don't know if is correct this formula =EXP(SIN(A1)^2) or this one =2.71828*SIN(A1)^2, because I've got different results.
Tks in advance for your answers!