
|
|
#1
 03-01-2016, 05:28 AM
|
|||
|
|||
|
In most (maybe all) European languages other than English, a comma is used as a decimal separator where in English there is a dot. So the German version of Microsoft has the comma as the default decimal separator. It is possible to change this in Excel and have the dot as the decimal separator. However, when importing a graph from Excel to PowerPoint, the values revert to having a comma as a decimal separator, so 0,5 rather than 0.5. Since I want to make my presentation to a scientific conference where English is the official language, I would like to use throughout the PowerPoint presentation (including graphs imported from Excel) the English style, with the dot. It seems that changing the language to English does not affect what decimal separator is used in the graphs. Is there some other way to achieve this?
I attach a graph imported from Excel into PowerPoint to illustrate the problem. In Excel, the commas had been changed to dots by editing the advanced settings but when the graph is imported to PowerPoint, the decimal separator reverts to the comma. 
|
|
#2
03-01-2016, 09:33 AM
|
|||
|
|||
|
Pretty sure in PowerPoint that is controlled by the Windows Region & Language settings in Control Panel.
If you set this (temporarily) to English you should see the period as decimal separator. Not sure if that will cause other problems though.
|
|
#3
03-03-2016, 09:52 AM
|
|||
|
|||
|
Quote:
|
|
#4
03-03-2016, 10:43 AM
|
|||
|
|||
|
Just to check when you say the language is set to British English you do mean in Windows > Region and Language not Office spell check.
You can check the decimal separator in Additional settings 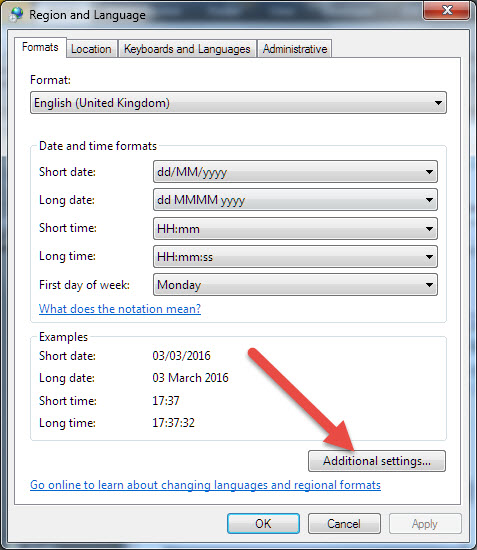 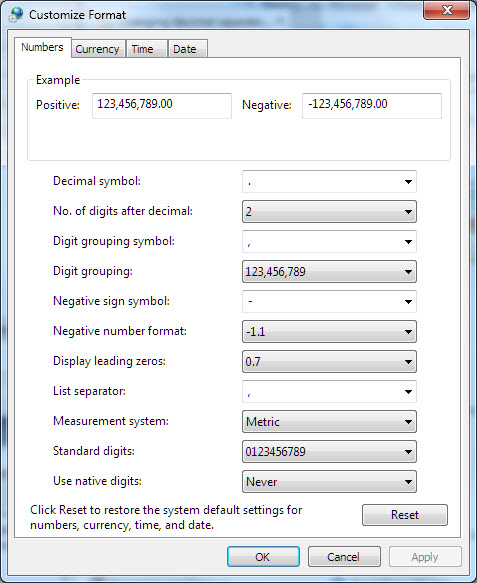
|
|
#5
04-06-2016, 04:51 AM
|
|||
|
|||
|
Thank you for your efforts and sorry for not replying earlier but reversing the use of comma and dot is not available under Additional Settings. The only option for the decimal symbol is the comma and for the digit grouping symbol the dot.
EDIT: My apologies, reversing the use of the comma and dot turns out to be possible under the Additional Settings once the language is changed from German to English. Thanks! +rep Last edited by N_Aggelopoulos; 04-06-2016 at 11:01 AM.
|
|
#6
04-07-2016, 04:56 AM
|
|||
|
|||
|
Good to know!
|

|
|
|
 Similar Threads
|
||||
| Thread | Thread Starter | Forum | Replies | Last Post |
| Decimal tabs with space as thousands separator | harry | Word | 1 | 12-22-2023 02:59 PM |
| Pulling 2 digits before a decimal point from adjoining cell then zeros after decimal | jadess916 | Excel | 1 | 06-26-2014 03:48 AM |
 Decimal alignment of numbers that use blank space as a thousands separator Decimal alignment of numbers that use blank space as a thousands separator
|
Aston | Word | 1 | 07-24-2012 11:44 PM |
|
Comma style without trailing zeroes but with decimal part
|
Scaffold | Excel | 3 | 10-22-2011 11:08 PM |
|
thousands comma separator
|
taylormayd | Excel | 3 | 02-20-2009 03:46 AM |


 Linear Mode
